Centre candidates and clustering
An image processing pipeline to detect and localize Drosophila egg chambers that consists of the following steps: (i) superpixel-based image imsegm into relevant tissue classes (see above); (ii) detection of egg center candidates using label histograms and ray features; (iii) clustering of center candidates. Prepare zones for training center candidates and perfom desity clustering.
Borovec, J., Kybic, J., & Nava, R. (2017). Detection and Localization of Drosophila Egg Chambers in Microscopy Images. In Q. Wang, Y. Shi, H.-I. Suk, & K. Suzuki (Eds.), Machine Learning in Medical Imaging, (pp. 19–26).
[1]:
%matplotlib inline
import os, sys
import numpy as np
from PIL import Image
from sklearn import cluster
import matplotlib.pylab as plt
[2]:
sys.path += [os.path.abspath('.'), os.path.abspath('..')] # Add path to root
import imsegm.utilities.data_io as tl_io
import imsegm.ellipse_fitting as seg_fit
import imsegm.descriptors as seg_fts
import imsegm.classification as seg_clf
WARNING:root:descriptors: using pure python libraries
/usr/local/lib/python3.5/dist-packages/sklearn/cross_validation.py:41: DeprecationWarning: This module was deprecated in version 0.18 in favor of the model_selection module into which all the refactored classes and functions are moved. Also note that the interface of the new CV iterators are different from that of this module. This module will be removed in 0.20.
  "This module will be removed in 0.20.", DeprecationWarning)
/usr/local/lib/python3.5/dist-packages/sklearn/grid_search.py:42: DeprecationWarning: This module was deprecated in version 0.18 in favor of the model_selection module into which all the refactored classes and functions are moved. This module will be removed in 0.20.
  DeprecationWarning)
Load images
[3]:
name = 'insitu7545'
PATH_BASE = tl_io.update_path(os.path.join('data-images', 'drosophila_ovary_slice'))
PATH_IMAGES = os.path.join(PATH_BASE, 'image')
PATH_SEGM = os.path.join(PATH_BASE, 'segm')
PATH_ANNOT = os.path.join(PATH_BASE, 'annot_eggs')
PATH_CENTRE = os.path.join(PATH_BASE, 'center_levels')
COLORS = 'bgrcymk'
[4]:
img = np.array(Image.open(os.path.join(PATH_IMAGES, name + '.jpg')))
segm = np.array(Image.open(os.path.join(PATH_SEGM, name + '.png')))
annot = np.array(Image.open(os.path.join(PATH_ANNOT, name + '.png')))
levels = np.array(Image.open(os.path.join(PATH_CENTRE, name + '.png')))
FIG_SIZE = (10. * np.array(img.shape[:2]) / np.max(img.shape))[::-1]
Show training for center detection
In this part we discuss the procedure of preparing training data…
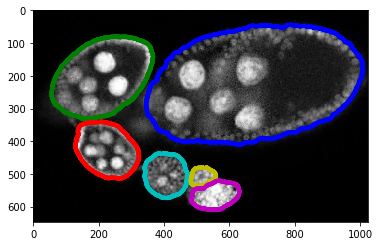
Individual egg annotation
[5]:
#plt.figure(figsize=FIG_SIZE)
plt.imshow(img[:, :, 0], cmap=plt.cm.Greys_r)
# _= plt.contour(annot, levels=np.unique(annot), linewidths=(4,))
for i in range(1, np.max(annot) + 1):
    _= plt.contour(annot == i, colors=COLORS[(i-1) % len(COLORS)], linewidths=(4,))
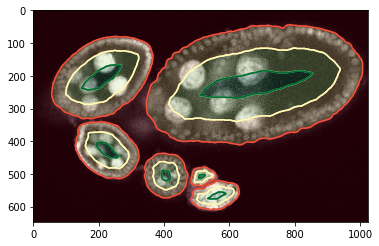
Zones inside eggs
We have generated zones inside each objetc/egg such as we divide into 3 centric shapes. In fact this annotation can be automatly created by oour scipt and then manually adjasted.
[6]:
#plt.figure(figsize=FIG_SIZE)
plt.imshow(img[:, :, 0], cmap=plt.cm.Greys_r)
_= plt.imshow(levels, alpha=0.2, cmap=plt.cm.RdYlGn), plt.contour(levels, cmap=plt.cm.RdYlGn)
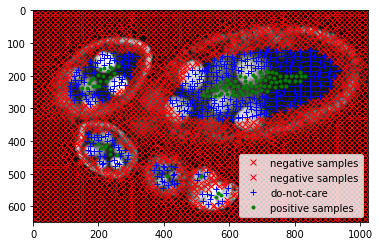
Training examples, points
We assume that the center zone is postive (green), background and near boundary is negative (red) and the zone in between we ignore (blue).
[8]:
slic, points, labels = seg_fit.get_slic_points_labels(levels, img, slic_size=15, slic_regul=0.3)
#plt.figure(figsize=FIG_SIZE)
plt.imshow(img[:, :, 0], cmap=plt.cm.Greys_r)
plt.plot(points[labels == 0, 1], points[labels == 0, 0], 'xr', label='negative samples')
plt.plot(points[labels == 1, 1], points[labels == 1, 0], 'xr', label='negative samples')
plt.plot(points[labels == 2, 1], points[labels == 2, 0], '+b', label='do-not-care')
plt.plot(points[labels == 3, 1], points[labels == 3, 0], '.g', label='positive samples')
_= plt.xlim([0, img.shape[1]]), plt.ylim([img.shape[0], 0]), plt.legend(loc='lower right')
Feature extraction for each sample point.
[9]:
features_hist, names_hist = seg_fts.compute_label_histograms_positions(segm, points, diameters=[25, 50, 100, 150, 200, 300])
features_ray, _, names_ray = seg_fts.compute_ray_features_positions(segm, points, angle_step=15, edge='up', border_labels=[0], smooth_ray=0)
features = np.hstack((features_hist, features_ray))
Adjustment the annotation as we decribed before and train a classifier…
[10]:
clf_pipeline = seg_clf.create_clf_pipeline()
labels[labels == 1] = 0
labels[labels == 3] = 2
clf_pipeline.fit(features, labels)
[10]:
Pipeline(memory=None,
     steps=[('scaler', StandardScaler(copy=True, with_mean=True, with_std=True)), ('reduce_dim', PCA(copy=True, iterated_power='auto', n_components=0.95, random_state=None,
  svd_solver='auto', tol=0.0, whiten=False)), ('classif', RandomForestClassifier(bootstrap=True, class_weight=None, criterion='gini'..._jobs=-1,
            oob_score=False, random_state=None, verbose=0,
            warm_start=False))])
Predict lables for these sample points, note that overfitting may appeare.
[11]:
labels = clf_pipeline.predict(features)
candidates = points[labels == 2, :]
Center clustering
Visualisation of predicted positive sample points…
[12]:
# candidates = points[labels == 3, :]
#plt.figure(figsize=FIG_SIZE)
plt.imshow(img[:, :, 0], cmap=plt.cm.Greys_r)
plt.imshow(segm, alpha=0.2, cmap=plt.cm.jet), plt.contour(segm, cmap=plt.cm.jet)
_= plt.plot(candidates[:, 1], candidates[:, 0], '.w')
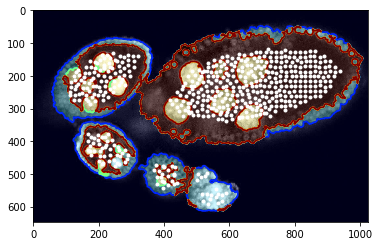
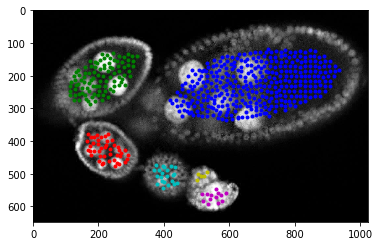
As you can see that potentila points inside egg are more less grouped together. We apply decity clustering which alloes us to identify individual eggs.
[17]:
dbscan = cluster.DBSCAN(eps=40, min_samples=1)
dbscan.fit(candidates)
[17]:
DBSCAN(algorithm='auto', eps=40, leaf_size=30, metric='euclidean',
    metric_params=None, min_samples=1, n_jobs=1, p=None)
[18]:
#fig = plt.figure(figsize=FIG_SIZE)
plt.imshow(img[:, :, 0], cmap=plt.cm.Greys_r)
# plt.imshow(seg, alpha=0.2), plt.contour(seg)
centers = []

for i in range(max(dbscan.labels_) + 1):
    select = candidates[dbscan.labels_ == i]
    centers.append(np.mean(select, axis=0))
    plt.plot(select[:, 1], select[:, 0], '.', color=COLORS[i % len(COLORS)])
centers = np.array(centers)

for i in range(len(centers)):
    fig.gca().scatter(centers[i, 1], centers[i, 0], s=300, c=COLORS[i % len(COLORS)])
    # plt.plot(centers[i, 1], centers[i, 0], 'o', color=COLORS[i % len(COLORS)])
_= plt.xlim([0, img.shape[1]]), plt.ylim([img.shape[0], 0])
[ ]: