Ellipse fitting from center
Having a center per egg and structural segmentation we want to aproximate the egg by an ellise fuct way that it maximise the expectation being single egg. Some ellipse fitting references: * Fitting an Ellipse to a Set of Data Points * Numerically Stable Direct Least Squares Fitting Of Ellipses * Non-linear fitting to an ellipse
Borovec, J., Kybic, J., & Nava, R. (2017). Detection and Localization of Drosophila Egg Chambers in Microscopy Images. In Q. Wang, Y. Shi, H.-I. Suk, & K. Suzuki (Eds.), Machine Learning in Medical Imaging, (pp. 19–26).
[1]:
%matplotlib inline
import os, sys
import numpy as np
import pandas as pd
from PIL import Image
import matplotlib.pylab as plt
[2]:
sys.path += [os.path.abspath('.'), os.path.abspath('..')] # Add path to root
import imsegm.utilities.data_io as tl_io
import imsegm.utilities.drawing as tl_visu
import imsegm.ellipse_fitting as tl_fit
WARNING:root:descriptors: using pure python libraries
Loading data
[3]:
PATH_BASE = tl_io.update_path(os.path.join('data_images', 'drosophila_ovary_slice'))
PATH_IMAGES = os.path.join(PATH_BASE, 'image')
PATH_SEGM = os.path.join(PATH_BASE, 'segm')
PATH_ANNOT = os.path.join(PATH_BASE, 'annot_eggs')
PATH_CENTRE = os.path.join(PATH_BASE, 'center_levels')
COLORS = 'bgrmyck'
Loading images…
[4]:
name = 'insitu7545'
# name = 'insitu11151'
img = np.array(Image.open(os.path.join(PATH_IMAGES, name + '.jpg')))
seg = np.array(Image.open(os.path.join(PATH_SEGM, name + '.png')))
centers = pd.read_csv(os.path.join(PATH_CENTRE, name + '.csv'), index_col=0).values
centers = centers[:, [1, 0]]
FIG_SIZE = (8. * np.array(img.shape[:2]) / np.max(img.shape))[::-1]
/usr/local/lib/python3.5/dist-packages/IPython/kernel/__main__.py:5: FutureWarning: from_csv is deprecated. Please use read_csv(...) instead. Note that some of the default arguments are different, so please refer to the documentation for from_csv when changing your function calls
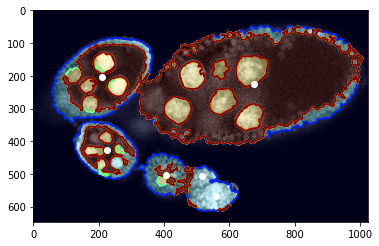
Visualisation of structure segmentation overlped over input image and marked center points.
[5]:
#fig = plt.figure(figsize=FIG_SIZE)
plt.imshow(img[:, :, 0], cmap=plt.cm.Greys_r)
plt.imshow(seg, alpha=0.2, cmap=plt.cm.jet), plt.contour(seg, cmap=plt.cm.jet)
_= plt.plot(centers[:, 1], centers[:, 0], 'ow')
Preprocess - estimate boundary points
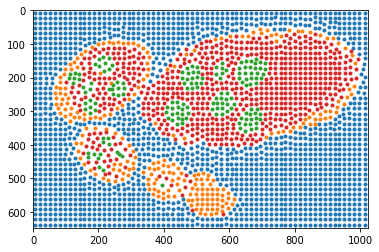
Visualisation of labeled sample points according structure segmentation / annotations.
[6]:
slic, points_all, labels = tl_fit.get_slic_points_labels(seg, slic_size=15, slic_regul=0.3)
# points_all, labels = egg_segm.get_slic_points_labels(seg, img, size=15, regul=0.25)
for lb in np.unique(labels):
    plt.plot(points_all[labels == lb, 1], points_all[labels == lb, 0], '.')
_= plt.xlim([0, seg.shape[1]]), plt.ylim([seg.shape[0], 0])
weights = np.bincount(slic.ravel())
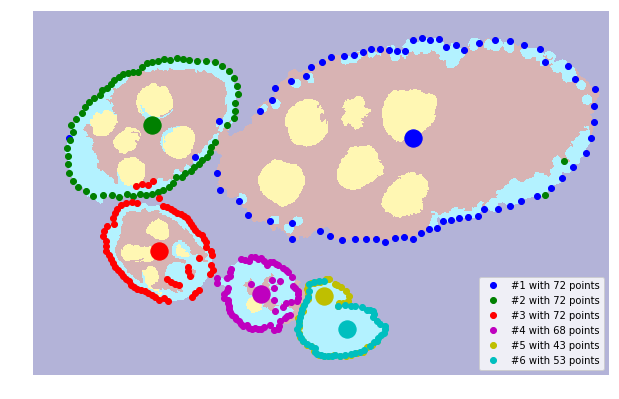
Reconstruction of boundary points using ray features from centers.
[7]:
points_centers = tl_fit.prepare_boundary_points_ray_edge(seg, centers, close_points=5)
# points_centers = tl_fit.prepare_boundary_points_ray_mean(seg, centers, close_points=5)
# points_centers = tl_fit.prepare_boundary_points_dist(seg, centers)
[8]:
fig = plt.figure(figsize=FIG_SIZE)
plt.imshow(seg, alpha=0.3, cmap=plt.cm.jet)
for i, points in enumerate(points_centers):
    plt.plot(points[:, 1], points[:, 0], 'o', color=COLORS[i % len(COLORS)], label='#%i with %i points' % ((i + 1), len(points)))
for i in range(len(centers)):
    # plt.plot(centers[i, 1], centers[i, 0], 'o', color=COLORS[i % len(COLORS)])
    plt.scatter(centers[i, 1], centers[i, 0], s=300, c=COLORS[i % len(COLORS)])
_= plt.legend(loc='lower right'), plt.axes().set_aspect('equal')
_= plt.xlim([0, seg.shape[1]]), plt.ylim([seg.shape[0], 0])
plt.axis('off'), fig.subplots_adjust(left=0, right=1, top=1, bottom=0)
# fig.savefig('fig1.pdf')
[8]:
((0.0, 1024.0, 647.0, 0.0), None)
Fit ellipse by RANDSAC and hypothesis
Set the probability of being egg for each class from initial segmentation.
[9]:
TABLE_FB_PROBA = [[0.01, 0.7, 0.95, 0.8],
                  [0.99, 0.3, 0.05, 0.2]]
print ('points: %i weights: %i labels: %i' % (len(labels), len(points_all), len(weights)))
points: 2652 weights: 2652 labels: 2652
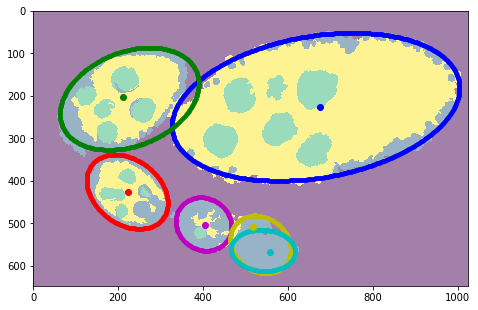
Fit the ellpse to maximise the hypoteses having single egg inside.
[10]:
plt.figure(figsize=FIG_SIZE)
plt.imshow(seg, alpha=0.5)
ellipses, crits = [], []
for i, points in enumerate(points_centers):
    model, _ = tl_fit.ransac_segm(points, tl_fit.EllipseModelSegm, points_all, weights,  labels,
                                  TABLE_FB_PROBA, min_samples=0.4, residual_threshold=10, max_trials=150)
    if model is None: continue
    c1, c2, h, w, phi = model.params
    ellipses.append(model.params)
    crit = model.criterion(points_all, weights, labels, TABLE_FB_PROBA)
    crits.append(np.round(crit))
    print ('model params: %s' % repr(int(c1), int(c2), int(h), int(w), phi))
    print ('-> crit: %f' % model.criterion(points_all, weights, labels, TABLE_FB_PROBA))
    rr, cc = tl_visu.ellipse_perimeter(int(c1), int(c2), int(h), int(w), phi)
    plt.plot(cc, rr, '.', color=COLORS[i % len(COLORS)])

# plt.plot(centers[:, 1], centers[:, 0], 'o')
for i in range(len(centers)):
    plt.plot(centers[i, 1], centers[i, 0], 'o', color=COLORS[i % len(COLORS)])
_= plt.xlim([0, seg.shape[1]]), plt.ylim([seg.shape[0], 0])
model params: (226, 666, 166, 342, 0.17135703308989025)
-> crit: -233334.76990445034
model params: (207, 227, 170, 110, 1.9451957515390759)
-> crit: -50842.71570683058
model params: (426, 222, 75, 104, -0.6423584612776315)
-> crit: -23629.744544518864
model params: (502, 402, 67, 60, 1.0308971690398319)
-> crit: -8080.076096030485
model params: (550, 536, 62, 75, -0.6448045520560932)
-> crit: -7626.153548780507
model params: (564, 542, 48, 75, -0.06859638756844778)
-> crit: -9202.723298924388
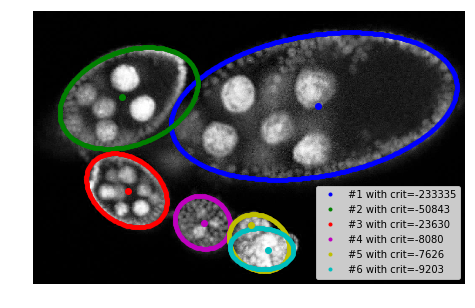
Visualizations
[12]:
#fig = plt.figure(figsize=FIG_SIZE)
# plt.imshow(img)
plt.imshow(img[:, :, 0], cmap=plt.cm.Greys_r)
for i, params in enumerate(ellipses):
    c1, c2, h, w, phi = params
    rr, cc = tl_visu.ellipse_perimeter(int(c1), int(c2), int(h), int(w), phi)
    plt.plot(cc, rr, '.', color=COLORS[i % len(COLORS)], label='#%i with crit=%d' % ((i + 1), int(crits[i])))
plt.legend(loc='lower right')

# plt.plot(centers[:, 1], centers[:, 0], 'ow')
for i in range(len(centers)):
    plt.plot(centers[i, 1], centers[i, 0], 'o', color=COLORS[i % len(COLORS)])
plt.xlim([0, seg.shape[1]]), plt.ylim([seg.shape[0], 0])
_= plt.axis('off'), fig.subplots_adjust(left=0, right=1, top=1, bottom=0)
# fig.savefig('fig2.pdf')
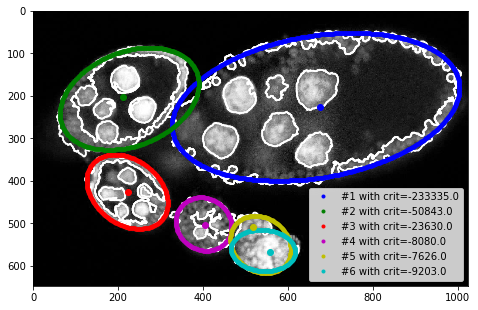
[14]:
plt.figure(figsize=FIG_SIZE)
plt.imshow(img[:, :, 0], cmap=plt.cm.Greys_r)
plt.contour(seg, colors='w') #, plt.imshow(seg, alpha=0.2)
for i, params in enumerate(ellipses):
    c1, c2, h, w, phi = params
    rr, cc = tl_visu.ellipse_perimeter(int(c1), int(c2), int(h), int(w), phi)
    plt.plot(cc, rr, '.', color=COLORS[i % len(COLORS)], label='#%i with crit=%.1f' % ((i + 1), crits[i]))
plt.legend(loc='lower right')

# plt.plot(centers[:, 1], centers[:, 0], 'ow')
for i in range(len(centers)):
    plt.plot(centers[i, 1], centers[i, 0], 'o', color=COLORS[i % len(COLORS)])
_= plt.xlim([0, seg.shape[1]]), plt.ylim([seg.shape[0], 0])
[ ]: