Sample supervised segmentation on Gray images
Image segmentation is widely used as an initial phase of many image processing tasks in computer vision and image analysis. Many recent segmentation methods use superpixels, because they reduce the size of the segmentation problem by an order of magnitude. In addition, features on superpixels are much more robust than features on pixels only. We use spatial regularization on superpixels to make segmented regions more compact. The segmentation pipeline comprises: (i) computation of superpixels; (ii) extraction of descriptors such as color and texture; (iii) soft classification, using a standard classifier for supervised learning; (iv) final segmentation using Graph Cut. We use this segmentation pipeline on four real-world applications in medical imaging. We also show that unsupervised segmentation is sufficient for some situations, and provides similar results to those obtained using trained segmentation.
Borovec, J., Svihlik, J., Kybic, J., & Habart, D. (2017). Supervised and unsupervised segmentation using superpixels, model estimation, and Graph Cut. Journal of Electronic Imaging.
[1]:
%matplotlib inline
import os, sys, glob, time
import numpy as np
from PIL import Image
import matplotlib.pyplot as plt
from skimage.segmentation import mark_boundaries
sys.path += [os.path.abspath('.'), os.path.abspath('..')] # Add path to root
import imsegm.utilities.data_io as tl_data
import imsegm.pipelines as segm_pipe
Load image
[2]:
path_dir = os.path.join(tl_data.update_path('data_images'), 'drosophila_ovary_slice')
path_images = os.path.join(path_dir, 'image')
print ([os.path.basename(p) for p in glob.glob(os.path.join(path_images, '*.jpg'))])
# loading images
path_img = os.path.join(path_images, 'insitu7545.jpg')
img = np.array(Image.open(path_img))[:, :, 0]
path_img = os.path.join(path_images, 'insitu4174.jpg')
img2 = np.array(Image.open(path_img))[:, :, 0]
# loading annotations
path_annots = os.path.join(path_dir, 'annot_struct')
path_annot = os.path.join(path_annots, 'insitu7545.png')
annot = np.array(Image.open(path_annot))
['insitu7331.jpg', 'insitu4174.jpg', 'insitu4358.jpg', 'insitu7545.jpg', 'insitu7544.jpg']
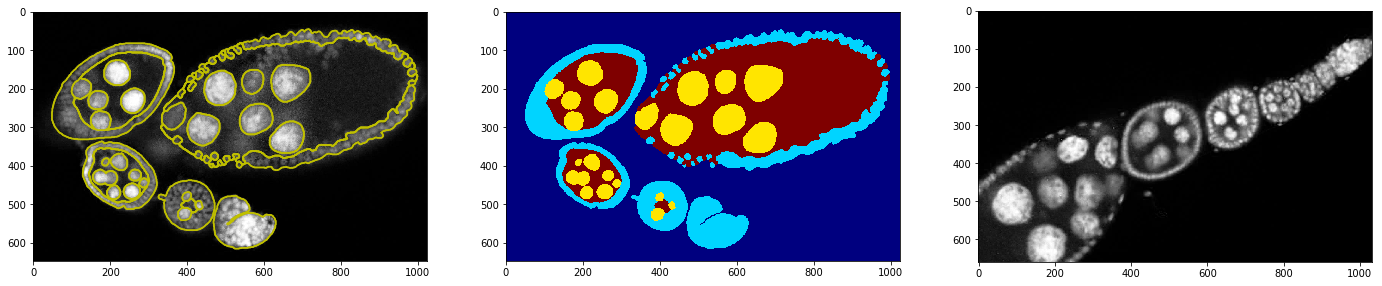
Show that training example with annotation and testing image
[14]:
FIG_SIZE = (8. * np.array(img.shape[:2]) / np.max(img.shape))[::-1]
fig = plt.figure(figsize=FIG_SIZE * 3)
_= plt.subplot(1,3,1), plt.imshow(img, cmap=plt.cm.Greys_r), plt.contour(annot, colors='y')
_= plt.subplot(1,3,2), plt.imshow(annot, cmap=plt.cm.jet)
_= plt.subplot(1,3,3), plt.imshow(img2, cmap=plt.cm.Greys_r)
Segment Image
Set segmentation parameters:
[4]:
sp_size = 25
sp_regul = 0.2
dict_features = {'color': ['mean', 'std', 'median'], 'tLM': ['mean']}
Train the classifier
[5]:
classif, list_slic, list_features, list_labels = segm_pipe.train_classif_color2d_slic_features([img], [annot],
             sp_size=sp_size, sp_regul=sp_regul, dict_features=dict_features, pca_coef=None)
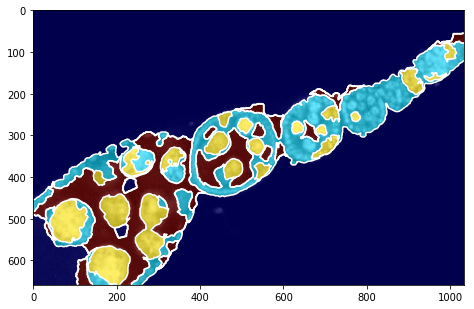
Perform the segmentation with trained classifier
[6]:
dict_debug = {}
seg, _ = segm_pipe.segment_color2d_slic_features_model_graphcut(img2, classif, sp_size=sp_size, sp_regul=sp_regul,
                   gc_regul=1., dict_features=dict_features, gc_edge_type='model', debug_visual=dict_debug)
[15]:
fig = plt.figure(figsize=FIG_SIZE)
plt.imshow(img2, cmap=plt.cm.Greys_r)
plt.imshow(seg, alpha=0.6, cmap=plt.cm.jet)
_= plt.contour(seg, levels=np.unique(seg), colors='w')
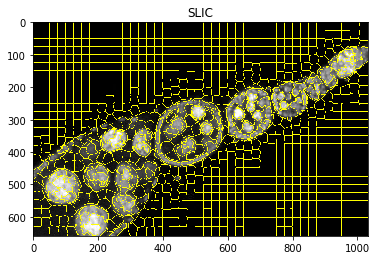
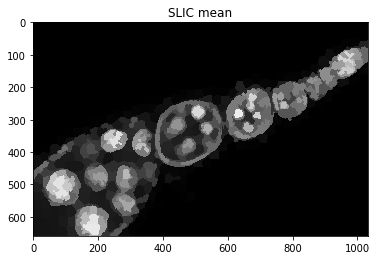
Visualise intermediate steps
[13]:
print ('debug fields: %s' % repr(dict_debug.keys()))
plt.figure(), plt.imshow(mark_boundaries(img2, dict_debug['slic'])), plt.title('SLIC')
plt.figure(), plt.imshow(dict_debug['slic_mean']), plt.title('SLIC mean')
plt.figure(), plt.imshow(dict_debug['img_graph_edges']), plt.title('graph edges')
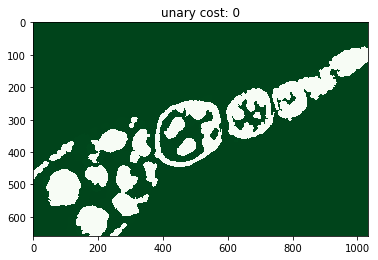
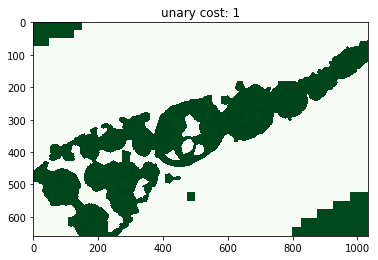
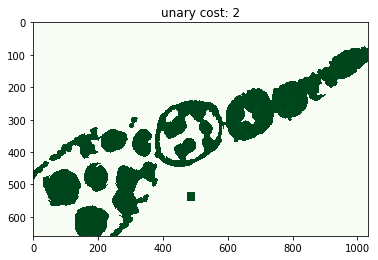
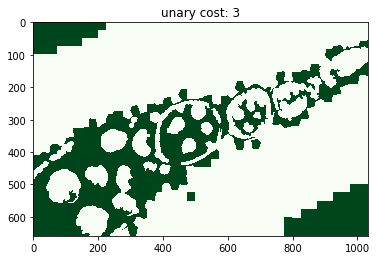
for i, im_u in enumerate(dict_debug['imgs_unary_cost']):
plt.figure(), plt.title('unary cost: %i' % i), plt.imshow(im_u)
# plt.figure(), plt.imshow(dict_debug['img_graph_segm'])
debug fields: dict_keys(['slic', 'img_graph_segm', 'slic_mean', 'segments', 'edge_weights', 'imgs_unary_cost', 'img_graph_edges', 'image', 'edges'])

[ ]: